
AI Coding Agent Dashboard: Orchestrating Claude Code Across Devices
Introduction
In December 2025 I wrote about becoming a coding orchestrator, shifting my role from implementer to someone who directs multiple AI coding agents working in parallel. The productivity gains were real, but so was the chaos.
Running 5 to 10 Claude Code sessions across multiple machines, different projects, and various git branches quickly became unmanageable. I'd forget about sessions, lose track of what was running where, and sometimes only rediscover abandoned work hours or days later.
Terminal tabs and tmux solve local organization. They do not solve cross-device visibility. I needed a single view of everything, so I built a dashboard.
The Problem: Orchestrating Without Visibility
My daily setup involves a MacBook for on-the-go work and a Linux workstation for heavier tasks. On any given day, I might have Claude Code sessions running across both machines, each tackling different tasks in different projects and branches.
The cognitive overhead of tracking which agent is doing what, on which machine, adds up fast. You have to remember which terminal window maps to which project, which branch each agent is working on, whether a session is still active or has stalled, and whether the agent is waiting for permission or has already finished.
Without a centralized view, the orchestrator workflow I described in my productivity post breaks down. You lose the parallelism advantage that makes AI-assisted development so powerful.
Existing tools only solve parts of this problem. Tmux and terminal multiplexers work great on a single machine, but they don't span devices. IDE-based solutions are tied to a specific editor. What I needed was a tool that could aggregate information from all my machines and present it in a single, real-time view.
As I discussed in The Future of Developer Tools, our tools need to adapt to AI-agent workflows. This dashboard is one example of what that adaptation looks like in practice.
The Real Challenge: Context Switching and Cognitive Load
One thing that doesn't get discussed enough is that the biggest bottleneck in AI-assisted parallel development isn't the AI itself. It's the human.
When you're orchestrating multiple agents, the cognitive load of context switching between sessions becomes the primary constraint. Which agent was working on what? Did that session finish or stall? Is the agent waiting for my input? Every time you have to answer these questions by opening terminals and inspecting state manually, you pay a context-switching tax that eats into the productivity gains you're trying to achieve.
This is the core challenge of the orchestrator era: managing the mental overhead of parallel work. Any tool that claims to support AI-assisted development needs to address this head-on.
The Dashboard: What It Does
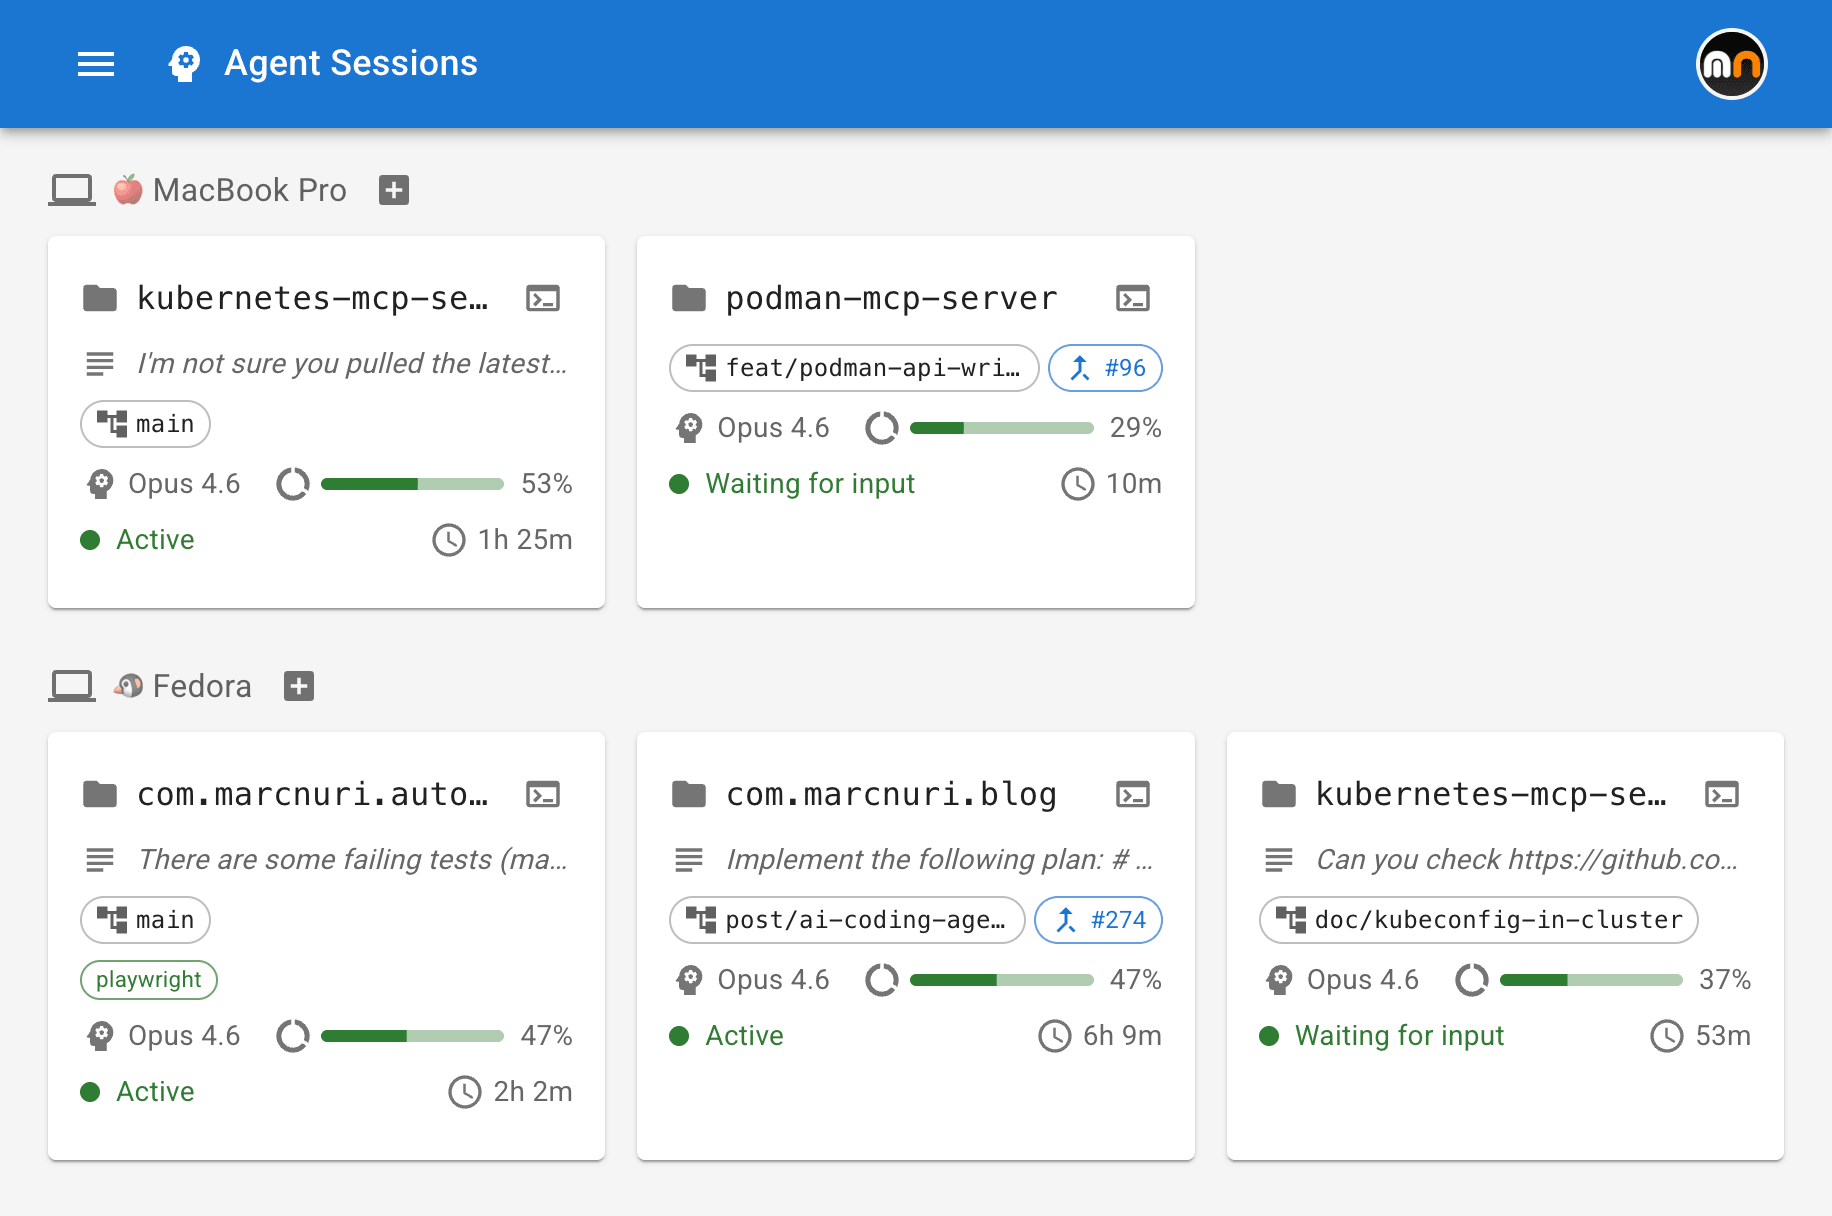
The dashboard provides a real-time overview of all my active coding agent sessions across every device and project.
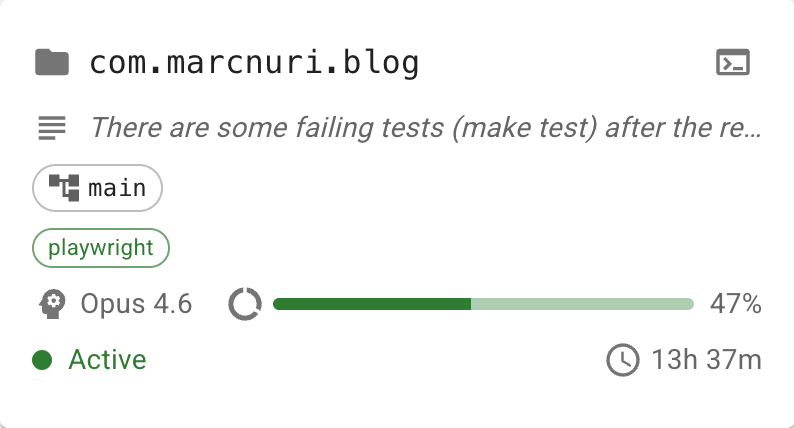
Sessions are organized by device, so I can immediately see what's running on my MacBook versus my workstation. Each session is represented by a card that displays key information at a glance:
- Project and git branch: Which repository and branch the agent is working on.
- Pull Request link: If the agent has created or is working on a PR, a direct link is shown.
- Model and context usage: Which LLM model the session is using and how much of the context window has been consumed.
- Status: Whether the agent is actively working, idle, or waiting for user permission.
- Task description: A summary of what the agent is currently doing.
- MCP servers: Which Model Context Protocol servers are connected to the session.
The dashboard updates in real time as agents report their state. It uses this stream of information to detect stale or crashed sessions automatically. If an agent stops reporting for too long, the session card reflects that something may have gone wrong.
By externalizing this state, the dashboard directly attacks the context-switching problem I described above. Instead of cycling through terminal windows to reconstruct what's happening, I can glance at the dashboard and know the state of every agent instantly.
Remote Terminal Attachment
The feature that changed everything for me is the ability to connect to any agent session directly from the browser.
I've seen developers set up elaborate solutions to achieve cross-device terminal access: Tailscale VPNs, SSH tunneling from their phones, complex tmux configurations with nested sessions, and custom scripts to keep everything in sync. These approaches work, but they add layers of friction and configuration that become their own maintenance burden.
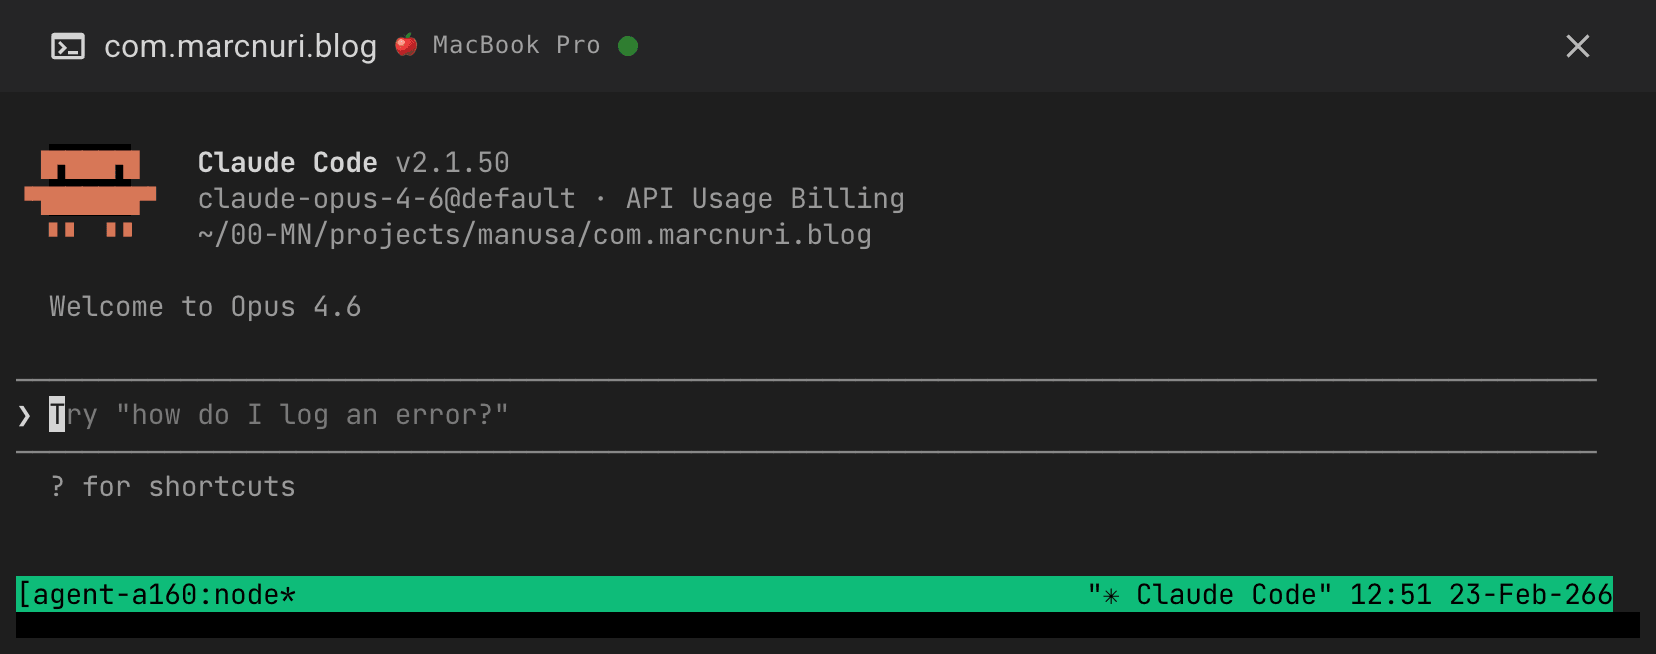
The dashboard takes a different approach. When I click on a session, I get a live terminal embedded right in the browser, attached to that agent's session. I can read the output, provide input, approve permissions, or intervene if the agent goes off track. No SSH setup, no VPN, no terminal app on my phone. Just a browser and the same interface everywhere.
This works from any device: my laptop, my phone, a tablet, or any machine with a web browser. During lunch, I can check on a long-running session from my phone. On the couch in the evening, I can review what an agent produced during the day from a tablet. The UX is the same everywhere because the interface is always the same web application.
On touch devices, an extra-keys toolbar (Esc, Ctrl, Tab, arrows) and clipboard bridging make the embedded terminal genuinely usable from a phone or tablet.
Security was a primary design concern from the start. This runs in my own environment with authenticated device registration and scoped access, so the goal is convenience without exposing raw terminal access publicly.
Spawn, Prime, Notify: Productive From Anywhere
If remote terminal attachment is the feature that keeps me connected, the next three are what keep me productive from anywhere. Each one removes a different friction point that shows up the moment you try to run several agents in parallel without sitting in front of the machine.
Spawning Sessions and Worktrees: Parallel Without Stepping on Each Other
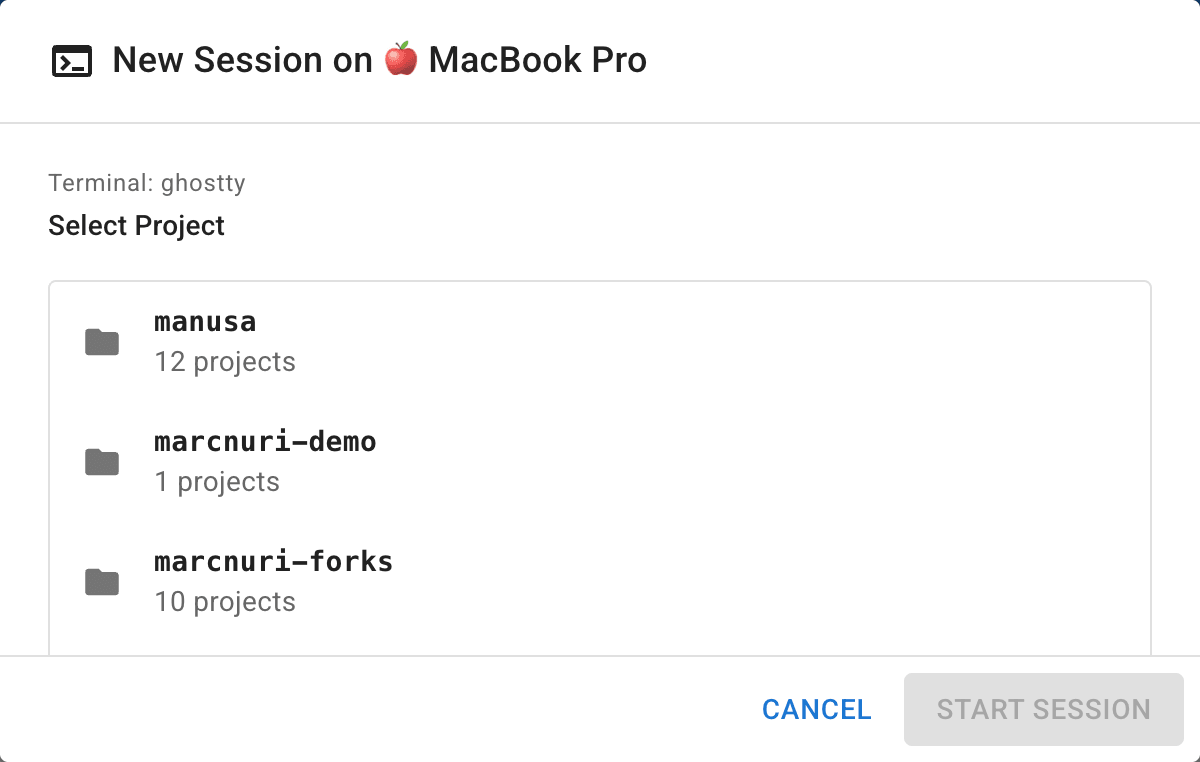
From the dashboard, I can start a new Claude Code session on any of my registered devices. I pick a device, select a project from its available repositories, and a fresh agent session spins up in a new tmux window on that machine. The dashboard picks it up immediately and starts tracking it. This means I can kick off agent sessions while commuting, then sit down later to review the results, and distribute work across machines based on what each one is best suited for.
The piece that turns this from a convenience into something I rely on is the worktree picker. For the chosen project, the spawn dialog lists the existing git worktrees on that device and lets me either attach a new agent to one of them, or type a fresh branch name to spin up a brand-new worktree on the fly. Branch names are validated, so a typo never wedges the working tree. This matters because at five or ten parallel agents on the same repository, the bottleneck is no longer compute. The real cost is agents stepping on each other. Worktrees give every agent its own isolated filesystem, and the picker turns that into a one-click decision instead of a context switch into the terminal.
Workflow Templates: Priming, Not Just Spawning
Spawning a fresh session in the right place is half the problem. The other half is what the agent does once it is there.
Workflow templates are opinionated, built-in prompts that prime a new session for a specific task instead of dropping the agent at a blank prompt.
Two ship today: Implement Issue and Review PR.
For Implement Issue, I paste a GitHub issue URL; the dialog parses repo and issue number, spawns a session in an issue-<number> worktree, and labels it #<number> Implement.
For Review PR, the same thing happens with a PR URL, optionally in a review-<number> worktree, labeled #<number> Review.
Each template embeds engineering-discipline guardrails I would otherwise paste from a snippets file every time: interview before you assume, write a failing test first, verify before claiming success, hand the diff to a peer-review pass.
The agent starts from a strong baseline rather than from whatever I happened to type into the spawn box during a coffee break.
Templates are configurable per-deployment via config.toml, and embedders can replace them entirely with their own prompts.
Push Notifications: The Loop Closes Back to You
Async delegation only works if the agent can find you when it needs to. Without that, you are back to polling the dashboard every few minutes, which defeats the point.
The dashboard registers a service worker that fires browser notifications on three transitions: Needs you when an agent is blocked waiting for human input, PR opened when a session has just produced a pull request, and Done when a session moves from working to idle. Clicking a notification deep-links straight to the relevant session card, so I am already where I need to act. Because they go through a service worker, the notifications survive the dashboard tab being closed, so I do not have to leave a browser window open all day to be paged. Awaiting-permission alerts beep because they actually need a human; the rest are silent so they pile up without nagging. The agents pull me back in only when there is something to do.
How It Works: Architecture Overview
Rather than walking through every implementation detail, I want to highlight the high-level architecture and the design decisions that make this system flexible.
The system follows a heartbeat model. Each coding agent session reports its state to the dashboard backend at regular intervals. This report includes project information, git status, context usage, active MCP servers, and the agent's current task.
The heartbeat data is gathered through coding agent hooks. In the case of Claude Code, these are notification hooks that fire when the agent transitions between states (working, idle, awaiting permission). The hooks execute a lightweight script that posts the session state to the dashboard API.
For terminal attachment, the backend establishes a WebSocket relay between the browser and the remote machine's terminal session. Since the agent and the human connect to the same underlying session, they can interact with it simultaneously.
The design decision I'm happiest with is the enricher pattern. The raw data coming from agent hooks is passed through a chain of enrichers, each responsible for extracting or deriving specific information. For example, one enricher parses the agent's transcript to extract model name, token usage, and context percentage. Another enricher detects PR URLs from the git branch.
This pattern is what makes the system extensible and agent-agnostic in the core dashboard, with agent-specific hooks and enrichers handling the adaptation layer. The dashboard doesn't need to know the internals of any particular coding agent. It only needs a hook script that sends heartbeats and an enricher that knows how to interpret the raw data. Supporting a new CLI agent, whether Goose, Gemini CLI, or any future tool, is mostly a matter of writing a new hook and a new enricher. The rest of the system remains unchanged.
The same composability applies to authentication. A pluggable auth layer lets the dashboard run with a zero-config pre-shared key on a personal laptop, or scale up to browser password auth, SSH challenge-response, or OIDC and per-user API tokens for team deployments. The goal is to adapt to each user's environment rather than force a single model.
Beyond standalone use, the dashboard is designed to be embeddable. I'm already integrating it into my personal automation platform, and the same plugin and auth interfaces that keep the core agent-agnostic also keep it tool-agnostic — it can live inside a larger system instead of replacing one.
A quick note on scope: this is currently optimized for live orchestration and intervention, not long-term analytics. The focus is real-time visibility and control across devices. I can add historical views later, but the immediate win was reducing the cost of checking and steering active sessions.
What I've Learned Running This
After several weeks of daily use, a few insights stand out.
Visibility reduces cognitive load dramatically. The single biggest improvement isn't any specific feature. It's simply being able to see everything at once. Before the dashboard, I spent mental energy tracking session states in my head. Now that state is externalized, I can focus on higher-level decisions like what to assign next and which results to review first.
Context percentage is the most actionable metric. Of all the fields on the dashboard, context usage has been the best predictor of where I should look next. When an agent is running high on context, it usually means I need to review progress, reset with a fresh session, or prepare for handoff.
PR awareness shortens the review loop. Seeing which sessions have produced pull requests, with direct links, lets me move from orchestration to review immediately instead of hunting through GitHub notifications.
Remote access changes when and where you can be productive. This sounds obvious in retrospect, but actually experiencing it is different from theorizing about it. Being able to start a session from my phone during a coffee break and review the results from my workstation an hour later has added genuinely productive moments to parts of the day that were previously dead time.
What's Next
The dashboard is functional and I use it daily. The roadmap is driven by one goal: reducing the need to leave the dashboard for anything, while keeping the core flexible enough to support very different users and workflows.
Short-term, the focus is on features that eliminate round-trips to other tools:
- Coding agent settings management: Configure agent behavior directly from the dashboard instead of editing configuration files on each machine.
- File attachment: Send files, context documents, or reference material to an agent session without switching to a terminal.
- Code diff viewer: Review the changes an agent has made without opening an IDE, closing a major gap in the orchestration workflow.
- Desktop application: A native desktop build for users who prefer a dedicated app over a browser tab.
On the extensibility front, support for additional coding agents is a natural next step. The enricher pattern I described above was designed with this in mind. As more CLI-based coding agents emerge, the dashboard should be able to aggregate sessions from all of them into the same unified view, regardless of which agent is running underneath. Beyond agent variety, integration with skills frameworks like Superpowers is another extensibility direction I am watching: the dashboard tracks what each agent is doing, while a skills framework shapes how it does the work.
For team and multi-user scenarios, OIDC authentication and per-user API tokens are on the way, so the same tool that works zero-config on a personal laptop also fits shared deployments.
Given the interest the project has already generated in the community, I'll be releasing the source publicly. Beyond making it available to others, I want to use it as a way to research how developers actually adapt to AI-assisted workflows — what they orchestrate, what they intervene on, what they ignore — and let that shape where the tool goes next.
If you're running parallel coding agents and have thoughts on what would make a tool like this more useful, I'd genuinely love to hear from you. Whether it's a feature idea, a different approach to the same problem, or just your experience managing multiple agents, reach out.
Conclusion
The shift from implementer to orchestrator that I described in my productivity post requires different tools. Standard terminals and IDEs were not built for one developer managing a fleet of AI agents across multiple machines.
This dashboard is my current answer to that gap. It gives me visibility, control, and a consistent way to monitor, intervene, and start work from anywhere.
Developers who learn to orchestrate AI agents effectively will have a real advantage in the next era of software engineering. And the tools we build today to support that orchestration, however rough around the edges, will shape what that era looks like.
I'm still iterating on this, and I'd welcome feedback, feature suggestions, and stories from anyone tackling similar challenges.


