
Prometheus and Grafana setup in Minikube
Introduction
In this post, I will show you how to deploy Prometheus and Grafana into your Minikube cluster using their provided Helm charts. Prometheus will help us monitor our Kubernetes Cluster and other resources running on it. Grafana will help us visualize metrics recorded by Prometheus and display them in fancy dashboards.
Note
Post last updated on 2023-09-20, thanks to Dennis Eller for his input.
Requirements
- Minikube
- Helm
Install Prometheus
The stable channel Prometheus charts have been deprecated in favor of the Prometheus Community Kubernetes Helm Charts.
We'll start by adding the repository to our helm configuration:
helm repo add prometheus-community https://prometheus-community.github.io/helm-chartsOnce the repo is ready, we can install the provided charts by running the following commands:
helm install prometheus prometheus-community/prometheus
kubectl expose service prometheus-server --type=NodePort --target-port=9090 --name=prometheus-server-np
The first command installs the charts. It will take a while until everything gets deployed, we can check the status by running:
kubectl get pods -l app.kubernetes.io/instance=prometheusSince we are using Minikube, the second command exposes the prometheus-server Service using a NodePort.
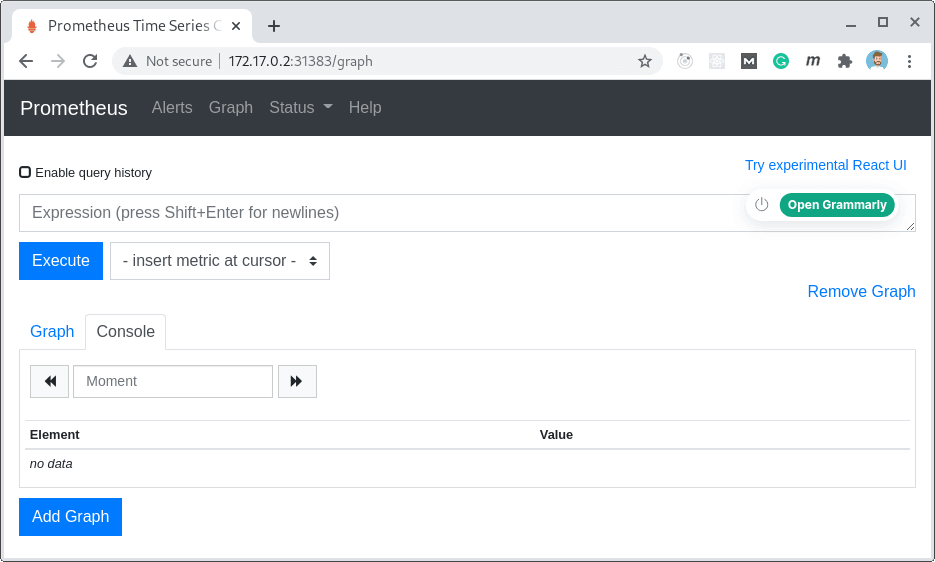
This way we can now easily access the Prometheus web interface when the Pod is ready:
minikube service prometheus-server-npThis will open a browser window with the Prometheus web interface.
Install Grafana
As with Prometheus, the stable channel official Helm charts for Grafana have been deprecated. The recommended charts are the ones hosted by the Grafana Community Kubernetes Helm Charts repository.
Same as before, we'll start by adding the repository to our helm configuration:
helm repo add grafana https://grafana.github.io/helm-chartsNext, we install Grafana by using the provided charts:
helm install grafana grafana/grafana
kubectl expose service grafana --type=NodePort --target-port=3000 --name=grafana-np
Again, since we are using Minikube, in order to easily access Grafana's Web interface we expose the service as a NodePort.
Note: Grafana is password protected by default, in order to retrieve the admin user password we can run the following command:
kubectl get secret --namespace default grafana -o jsonpath="{.data.admin-password}" | base64 --decode ; echoWe can now load the Grafana web interface using the admin user and the password retrieved:
minikube service grafana-np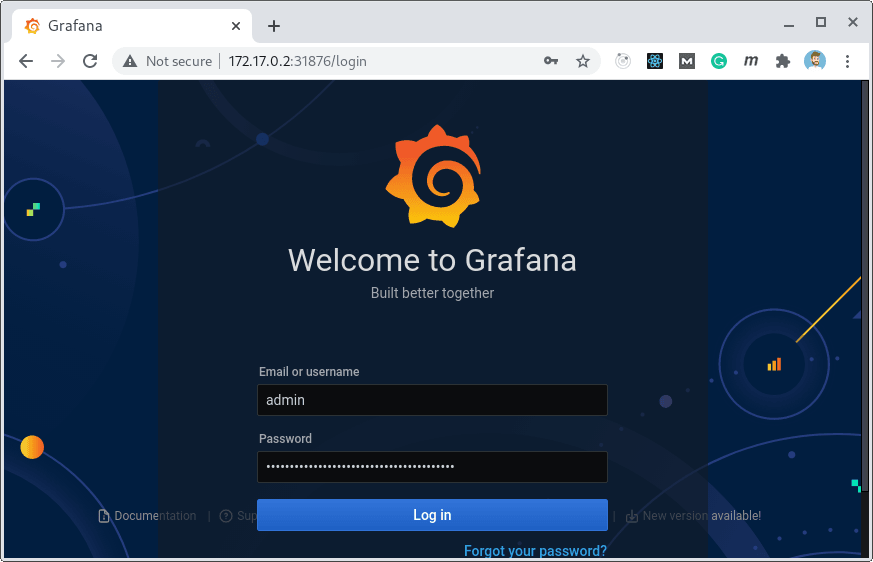
Configure Prometheus Datasource
Once we're logged in to the admin interface, it's time to configure the Prometheus Datasource.
We need to head to Connections > Datasources and add a new Prometheus instance.
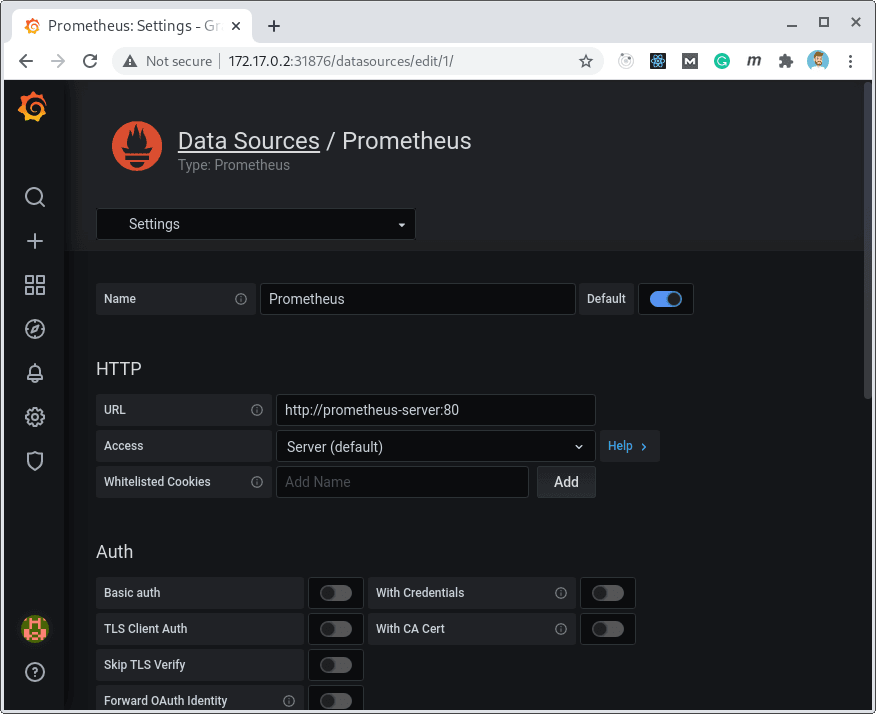
The URL for our Prometheus instance is the name of the service http://prometheus-server:80.
Kubernetes Dashboard bootstrap
Next, we'll set up one of the many already available community provided Kubernetes Dashboards.
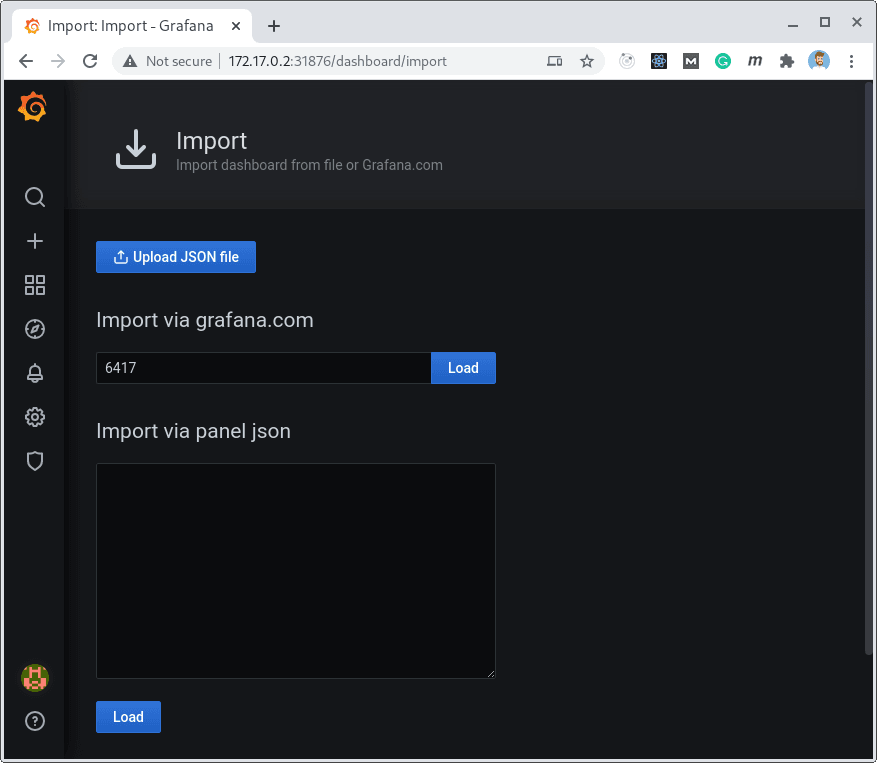
For this blog post I will be using this one https://grafana.com/grafana/dashboards/6417, but you can use any other Dashboard. You can even create your own very easily, but this will be covered in another post.
We head to Create (+) > Import section to Import via grafana.com and we set 6417 into the id field and click Load.
In the dashboard configuration we need to select the Prometheus Datasource we created in the earlier step.
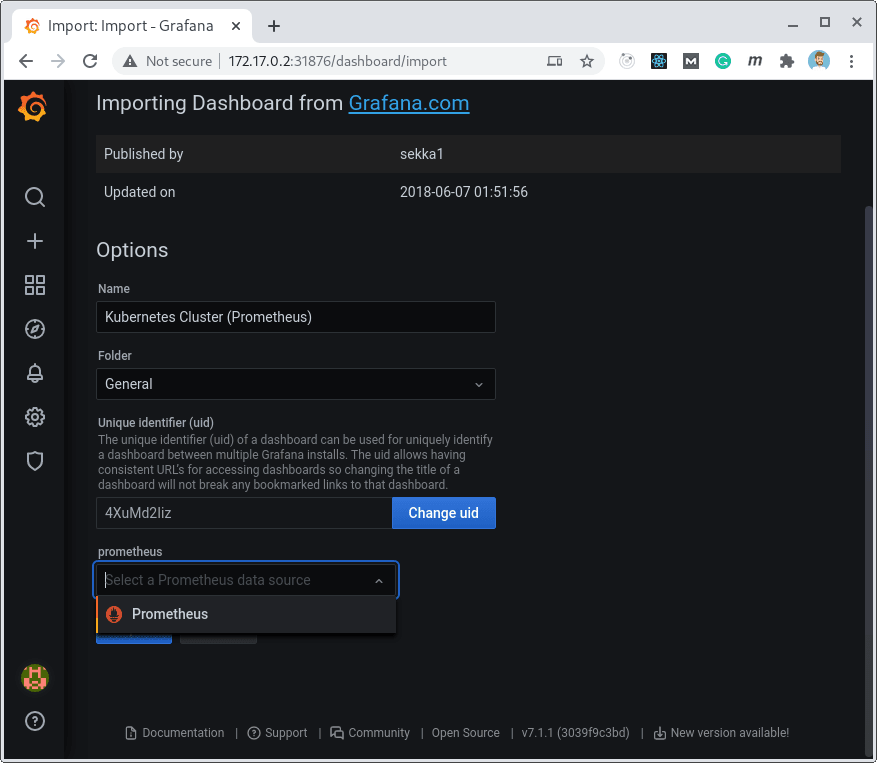
Once we confirm the Import dialog, we'll be redirected to the new Dashboard.
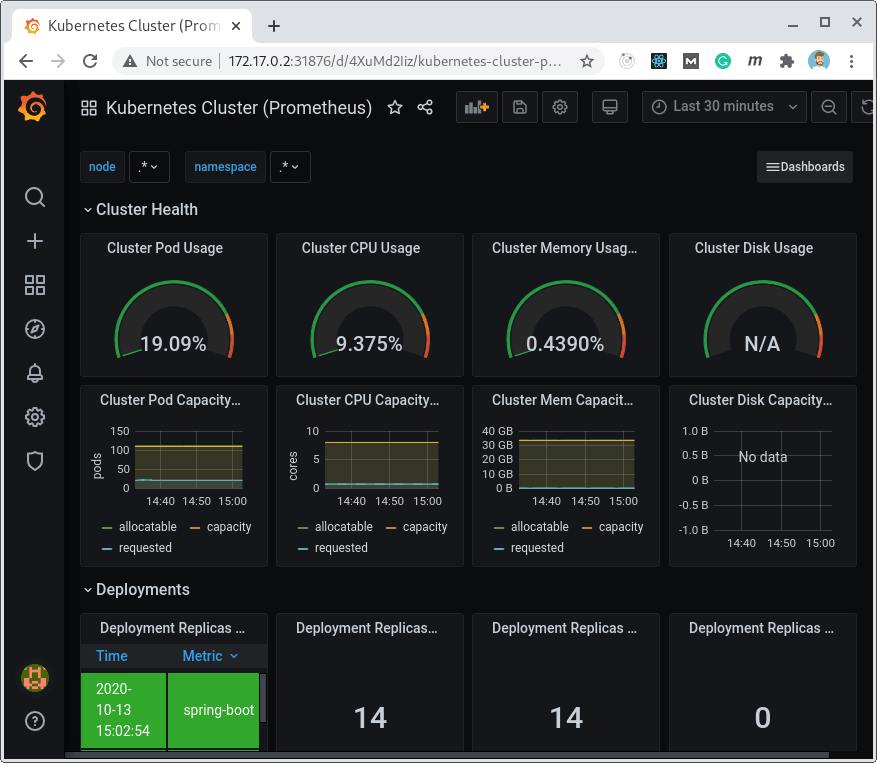
If everything went well, you'll be able to see your cluster's information in the Dashboard.
Conclusion
In this post, I've shown you how to install both Prometheus and Grafana into a Minikube cluster.
You can use the same procedure to do the same in any Kubernetes flavored cluster.
I've also explained how to deploy one of the grafana.com community dashboards simply by using its ID.
Hopefully this article will help you get started with Prometheus and Grafana and you’ll soon be able to create your own Dashboards and Panels.
If you're interested in dashboards and other ways to visualize your Kubernetes cluster resources, be sure to check out YAKC – Kubernetes Dashboard.


Comments in "Prometheus and Grafana setup in Minikube"